The second quarter 2019 average domestic itinerary air fare of $364 was an increase from both the first quarter of 2019 and the second quarter of 2018, adjusted for inflation.
Adjusted for inflation, (constant 2019 dollars) the 2Q 2019 air fare was:
- Up 2.5% from 2Q 2018 ($355)
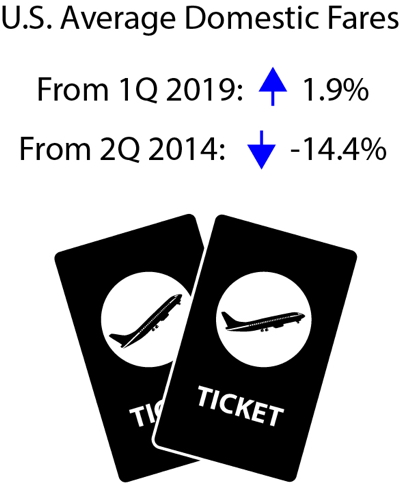
- Up 1.9% from 1Q 2019 ($358)
- Down 14.4% from 2Q 2014 ($426)
The 2Q average fare calculation does not include Frontier Airlines due to data reporting problems. The largest potential impacts would be in cities where Frontier has a substantial market share, such as Denver (12% market share) and Orlando (10% market share).
Itinerary Fares: Round-trips, but includes one-way tickets if no return is purchased.
Breakout of trip types: one-way, 40% ($265); round-trip, 60% ($440).
Fare calculations by BTS
Based on a random sample of 10% of the tickets.
Total ticket value: The price charged by airlines at time of ticket purchase.
Included: Additional taxes and fees levied by an outside entity at time of ticket purchase.
Not included: Fees for optional services, such as baggage fees
Figure 1. U.S. Average Domestic Fares, 2nd Quarter 1995-2019 Source:
Bureau of Transportation Statistics, Origin and Destination Survey
Second Quarter 2019 fare ($364):Compared to All Second Quarters: Down 28.1% from the highest 2Q fare, $507 in 1999.Compared to All Quarters: Down 29.4% from the highest fare for any quarter, $516 in 1Q 1999.Start of BTS records: Down 27.0% from 2Q 1995 ($499).Recent high: Down 14.4% from 4Q 2014 ($426).Recent low: Up 4.6% from 3Q 2018 ($348).All-time low: Up 4.6% from 3Q 2018 ($348).All-time second-quarter low: Up 2.5% from 2Q 2018 ($355).
Other Revenue: In recent years, airlines increasingly obtain additional revenue from passenger fees, as well as from other sources. U.S. passenger airlines collected 73.5% of total operating revenue of $70.5 billion from passenger fares during the first six months of 2019, down from 88.5% in 1990.
Second Quarter 2019 fare ($364):Trend: Up 3.1% from 1Q 2019 ($353)Compared to All Second Quarters: Down 7.9% from the highest 2Q fare, $396 in 2014Compared to All Quarters: Down 7.9% from the highest fare for any quarter, $395 in 2Q 2014Start of BTS records: Up 22.7% from 1Q 1995 ($297) (compared to 68.2% consumer price increase)Recent low: Up 8.5% from 3Q 2017 ($336)Recent high: Down 7.9% from 2Q 2014 ($396)All-time low: Up 32.1% from 2Q 1996 ($275).All-time second-quarter low: Up 32.1% from 2Q 1996 ($275).
Figure 2. Fares by Airport Group based on Number of Originating Domestic Passengers 2Q 2019 2Q Fares (current dollars) Source:
Bureau of Transportation Statistics, Origin and Destination Survey
Highest: Nine airports with 2+ million originating passengers ($374)Lowest: One airport with 50,000 to 99,999 originating passengers ($312)
Additional data: see Top 100 Airports or All Airports. Third Quarter 2019 average fare data will be released Jan. 14.
Standard error: Results for average fares are based on the BTS Origin & Destination Survey, a 10% sample of airline tickets used during the quarter. Averages for airports with smaller samples may be less reliable.
Note: Results for average fares are based on the BTS Origin & Destination Survey, a 10 percent sample of airline tickets used during the quarter. For results based on all itinerary fares, the standard error is 0.27. The 90% confidence interval ranges from $363.98 to $364.85. For results based on round-trip fares, the standard error is 0.33. The 90% confidence interval ranges from $439.48 to $440.56. For results based on one-way fares, the standard error is 0.33. The 90% confidence interval ranges from $264.77 to $265.86.